Using climate risk analytics to plan for hotter European summers
July 17, 2026
Key takeaways
- Record temperatures across western Europe in June underscored the heat-related infrastructure and cooling challenges facing many European countries in the upcoming decades.
- ICE’s global heat models project that northern European counties — including the U.K., Germany and France — will see steep percentage increases in cooling demand by 2050, yet many of these countries have household A/C ownership at or below 30%.
- One week consumed half a year's cooling budget: London's June heatwave alone generated 55% of its typical annual cooling degree days - the number of days on which cooling is required- and under Intergovernmental Panel on Climate Change’s high-end emissions scenario (SSP5-8.5) the city's annual cooling demand is projected to nearly double (+87%) by 2050, an increase that would reshape electricity demand patterns.
- Investors, lenders, and corporations can use these heat risk analytics to understand their exposure to heat-related impacts and prioritize adaptation efforts (cooling capacity, etc.) in critical facilities.
During London Climate Week 2026, western Europe experienced a severe heatwave. France reached 44.3°C (111.7°F) on 23 June, its highest temperature since national records began in 19471; the United Kingdom set a June record of 37.3°C2 (99.1°F); and Paris recorded a June high of 40.9°C.3 The heat strained electricity systems on both the demand and supply sides: surging air-conditioning load pushed Belgian day-ahead power above €1/kWh on 24 June and caused localized outages in Italy that closed the Uffizi Galleries in Florence.4 Elsewhere, a heat-related transformer fault cut power to about 68,000 households in north-western France.5 As of 28 June, the World Health Organization attributed more than 1,300 excess deaths across Europe to the heat.6
ICE’s global physical-risk model resolves cooling degree days (CDD) on a 0.5° grid by climate scenario.7 Air conditioning is currently the fastest-growing use for electricity in buildings worldwide. The relationship between hot weather and electricity use is proportional and the International Energy Agency (IEA) uses CDD as a proxy for space-cooling electricity demand.8 Under the Intergovernmental Panel on Climate Change’s (IPCC) high-end emissions scenario (SSP5-8.5) the model projects that annual CDD across Europe will rise between 2025 and 2050, with the largest absolute increases across southern Europe and the largest percentage increases across northern Europe (Figure 1).9
Europe's rising cooling demand
Cooling degree days represent the total number of degrees by which daily average temperature exceeds 18 degrees Celsius annually
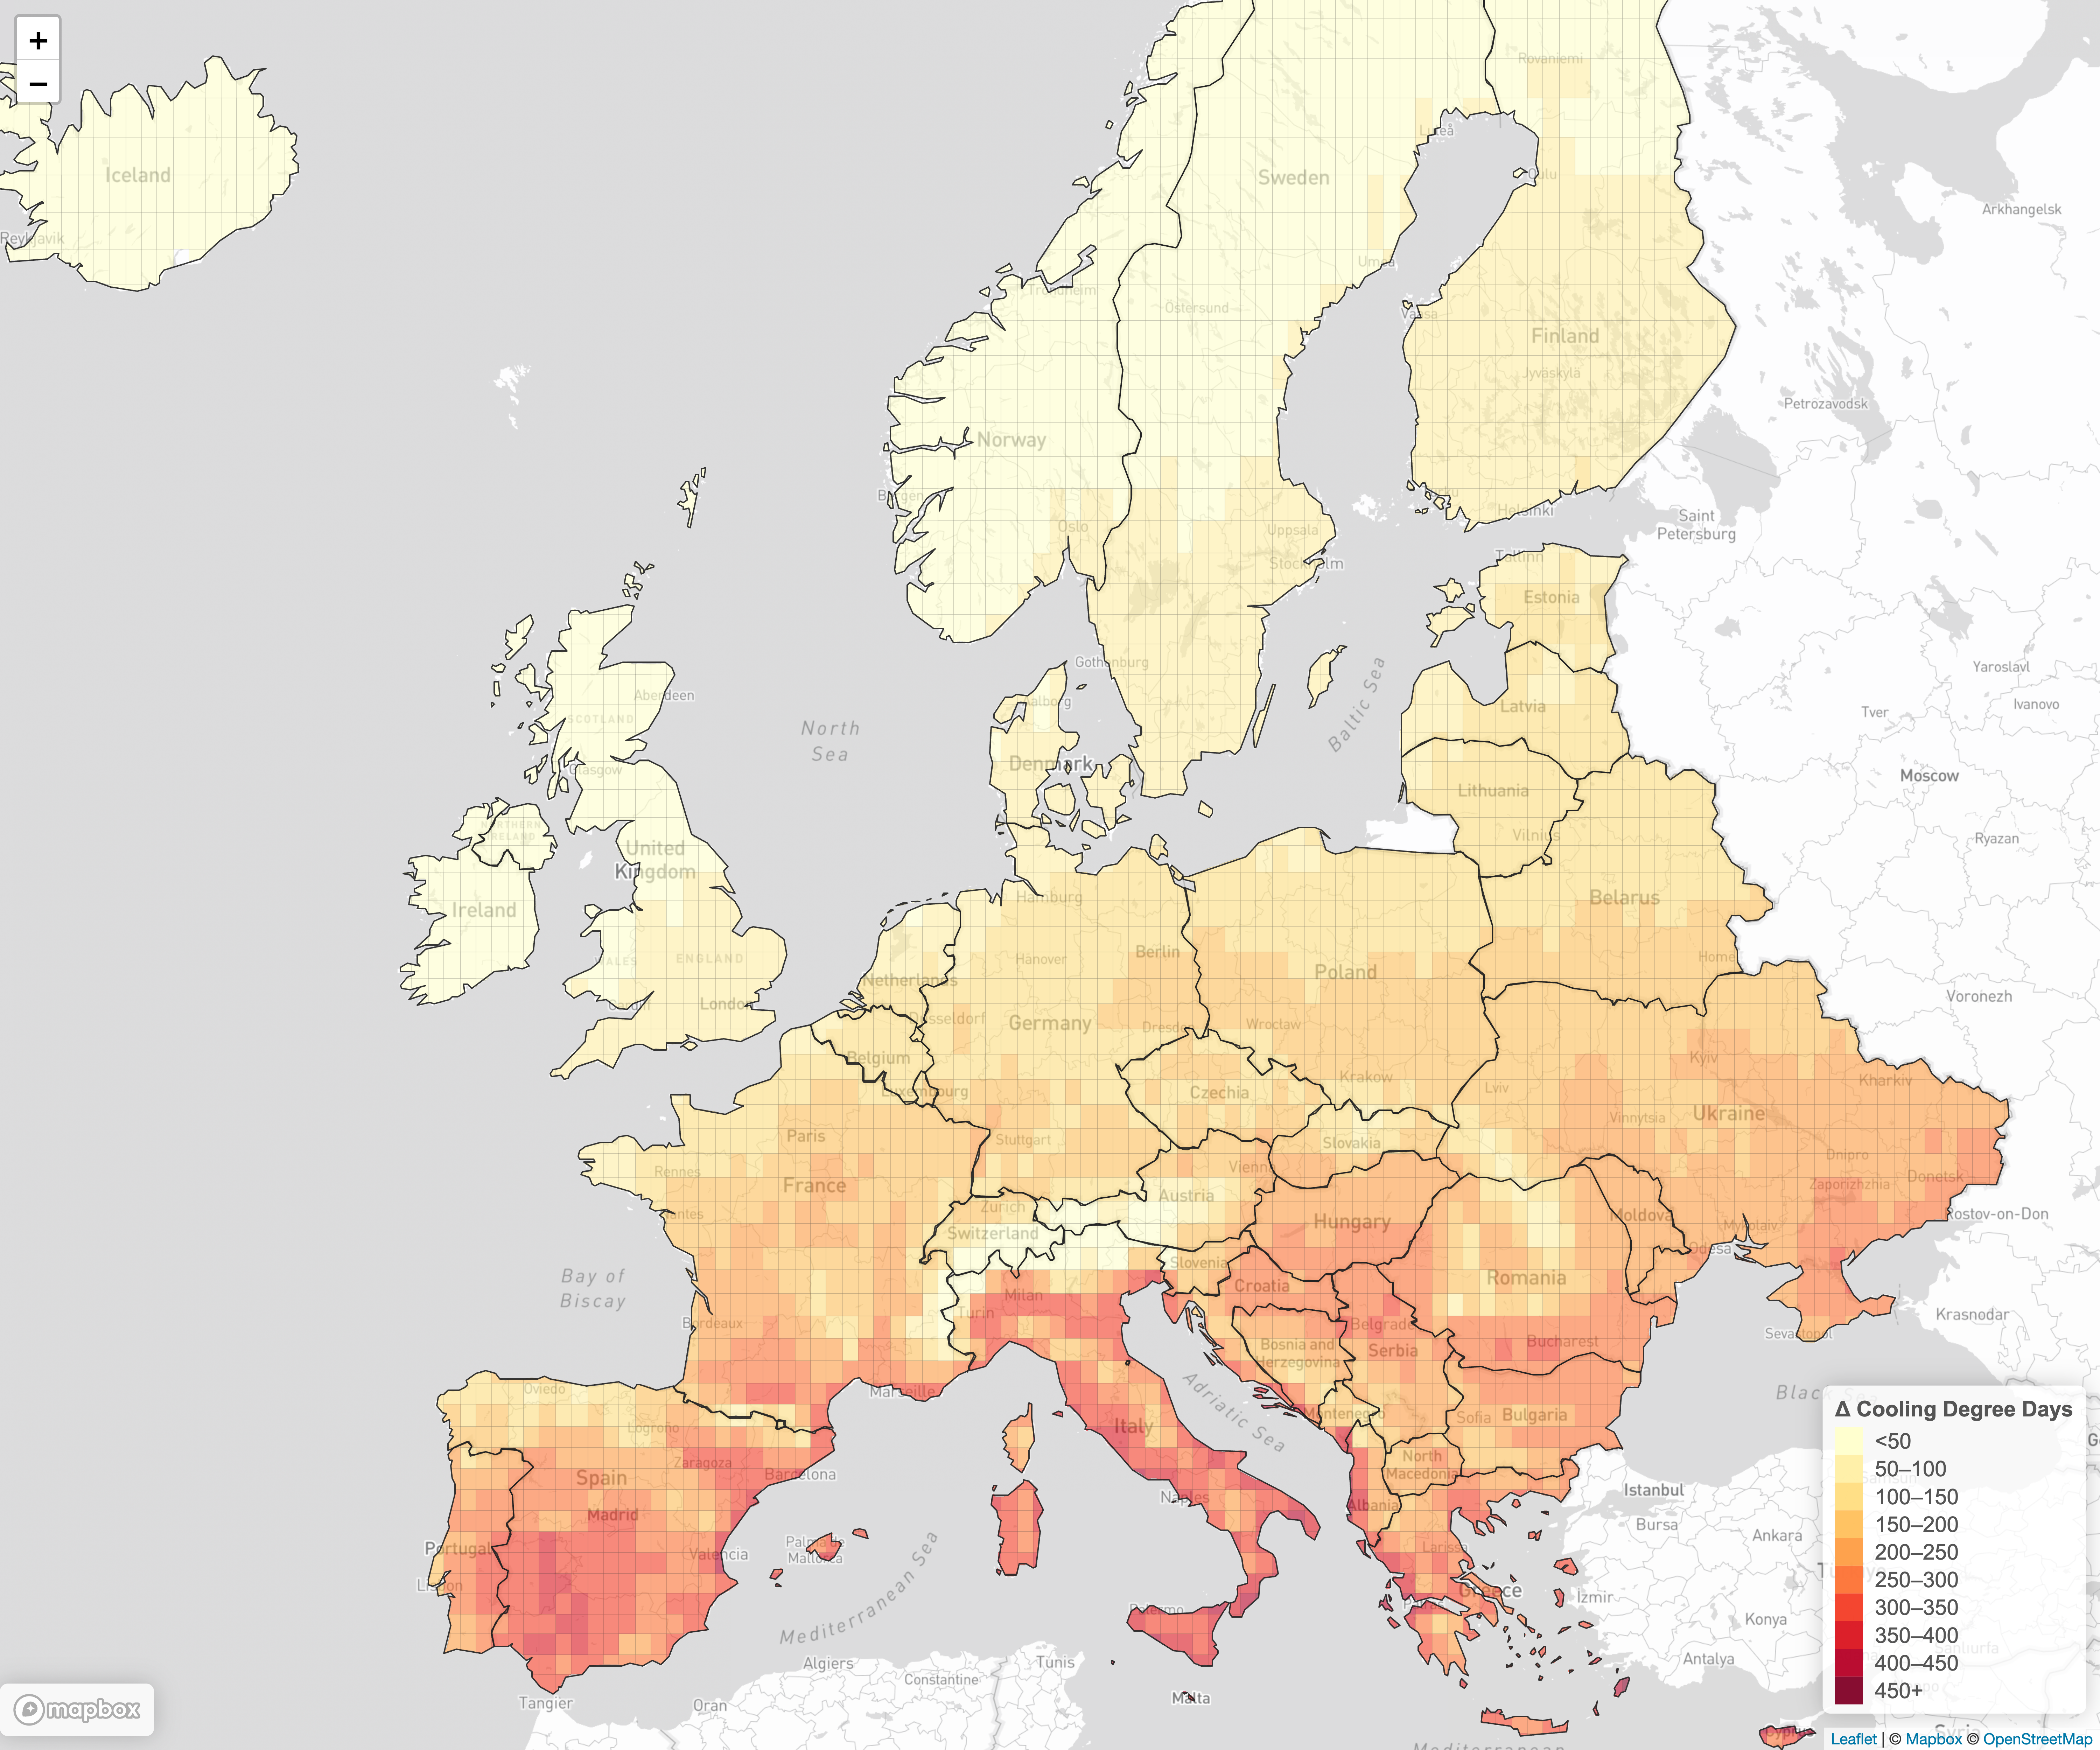
Figure 1. Projected change in cooling degree days, 2025–2050, under SSP5-8.5, on a 0.5° grid. Source: ICE Climate. Fn 10
The countries with the largest projected percentage increases in cooling degree days — the United Kingdom (+119% under SSP5-8.5; +73% under SSP2-4.5), Germany (+76%; +48%), and France (+63%; +41%) — have household air-conditioning ownership at or below the European average of approximately 19%.11, 12 Countries with higher current ownership, such as Italy (≈56%) and Greece (≈66%), show smaller projected percentage increases (Figure 2).13,14
Cooling need projections and air conditioning ownership in Europe
(SSP2-4.5 vs SSP5-8.5)
Figure 2. Projected percentage change in cooling degree days, 2025–2050 (SSP2-4.5 and SSP5-8.5), against current cooling degree days. Household air-conditioning ownership for six European countries is represented by the size of the circles. Country CDD aggregated from the 0.5° grid. Source: ICE Climate; air-conditioning ownership from International Energy Agency (IEA) and national statistics. Fn 15,16
Estimated from reported daily temperatures, the June 2026 heatwave produced cooling degree days equal to approximately 55% of London’s and 37% of Paris’s normal annual totals.17 Under SSP5-8.5, the model projects annual CDD increases of +87% for London and +59% for Paris between 2025 and 2050.18
Methodology
Cooling degree days are drawn from the ICE global physical-risk model on a 0.5° grid (years 2020–2060 by SSP scenario); country and city figures are the mean over inhabited grid cells, with values for 2025 and 2050 linearly interpolated.19 The model also produces heat-related excess-mortality projections, which are outside the scope of this analysis. Grid cells absent from the source table (uninhabited interior cells) are filled with the nearest available cell’s value, and cells are clipped to national boundaries (Figure 1). Heatwave cooling degree days are high-level estimates from reported daily high and low temperatures (daily mean approximated as (high + low)/2, base 18°C (64°F); windows: London ≈ 21–28 June 2026, Paris 17–28 June 2026); the relevant grid cell’s 2025 value is used for the normal annual total.20 CDD base-temperature definitions are approximate and may differ between the model and the event estimates. Iceland and Ireland are excluded from percentage figures because their small cooling baselines inflate percentage change. Forward-looking figures are model projections under stated scenarios, not forecasts.
- Météo-France, reported in NPR, “France records its hottest day ever as Europe withers in heat wave,” 23 June 2026, https://www.npr.org/2026/06/23/g-s1-129586/france-red-heat-wave-alert.
- Met Office, “June 2026 heatwave: a recap of the temperature records,” https://www.metoffice.gov.uk/blog/2026/june-2026-heatwave-a-recap-of-the-temperature-records.
- NBC News, “Temperature records smashed as extreme heat wave grips Europe,” https://www.nbcnews.com/world/europe/europe-heatwave-france-spain-uk-record-temperatures-eiffel-tower-rcna351710.
- Heatwave electricity-demand strain and prices, including Belgian day-ahead power exceeding €1/kWh on 24 June 2026 and air-conditioning-driven outages in Italy (Uffizi Galleries, Florence): Euronews, “Europe’s heatwave is straining the energy grid. Who’s most exposed?,” 23 June 2026, https://www.euronews.com/2026/06/23/europes-heatwave-could-trigger-blackouts-which-countries-are-most-exposed; Bloomberg, “Europe Heat Wave Strains Power Supply, Sends Prices Soaring,” 24 June 2026.
- France transformer fault leaving ~68,000 households without power (Finistère): Al Jazeera, “Power outages in France as Europe bakes in record heat,” 24 June 2026, https://www.aljazeera.com/news/2026/6/24/power-outage-in-france-as-europe-bakes-in-record-heat. French nuclear curtailment as river-cooling water warmed (e.g., Golfech): MIT Technology Review, “Europe’s extreme heat is shutting down power plants,” 24 June 2026, https://www.technologyreview.com/2026/06/24/1139676/europe-heat-power-plants/.
- World Health Organization, reported in Gulf News, “Europe heatwave linked to 1,300 excess deaths, WHO warns,” https://gulfnews.com/world/europe/europe-heatwave-linked-to-1-300-excess-deaths-who-1.500589847.
- ICE global physical-risk model, cooling degree days and excess mortality on a 0.5° grid by SSP scenario. Country/city figures aggregated as the mean over inhabited grid cells; 2025 and 2050 linearly interpolated.
- International Energy Agency, The Future of Cooling (2018), https://www.iea.org/reports/the-future-of-cooling, and IEA space-cooling tracking, https://www.iea.org/energy-system/buildings/space-cooling.
- ICE global physical-risk model, cooling degree days and excess mortality on a 0.5° grid by SSP scenario. Country/city figures aggregated as the mean over inhabited grid cells; 2025 and 2050 linearly interpolated.
- ICE global physical-risk model, cooling degree days and excess mortality on a 0.5° grid by SSP scenario. Country/city figures aggregated as the mean over inhabited grid cells; 2025 and 2050 linearly interpolated.
- ICE global physical-risk model, cooling degree days and excess mortality on a 0.5° grid by SSP scenario. Country/city figures aggregated as the mean over inhabited grid cells; 2025 and 2050 linearly interpolated.
- Household air-conditioning ownership (2023–24): EU average ≈19% (IEA); United Kingdom ≈5%, France ≈25%, Germany ≈19%, Spain ≈40%, Italy ≈56% (ISTAT, 2024), Greece ≈66% — IEA and national statistics/press.
- ICE global physical-risk model, cooling degree days and excess mortality on a 0.5° grid by SSP scenario. Country/city figures aggregated as the mean over inhabited grid cells; 2025 and 2050 linearly interpolated.
- Household air-conditioning ownership (2023–24): EU average ≈19% (IEA); United Kingdom ≈5%, France ≈25%, Germany ≈19%, Spain ≈40%, Italy ≈56% (ISTAT, 2024), Greece ≈66% — IEA and national statistics/press.
- ICE global physical-risk model, cooling degree days and excess mortality on a 0.5° grid by SSP scenario (dataset globalgrids…features_xtemp_by_occupancy_v_2_0, 2020–2060). Country/city figures aggregated as the mean over inhabited grid cells; 2025 and 2050 linearly interpolated.
- Household air-conditioning ownership (2023–24): EU average ≈19% (IEA); United Kingdom ≈5%, France ≈25%, Germany ≈19%, Spain ≈40%, Italy ≈56% (ISTAT, 2024), Greece ≈66% — IEA and national statistics/press.
- Heatwave cooling degree days estimated from reported daily high/low temperatures (Met Office; Météo-France), daily mean ≈ (high + low) / 2, base 18 °C. Normal annual CDD from the relevant grid cell of the ICE global physical-risk model (SSP5-8.5, 2025).
- ICE global physical-risk model, cooling degree days and excess mortality on a 0.5° grid by SSP scenario. Country/city figures aggregated as the mean over inhabited grid cells; 2025 and 2050 linearly interpolated.
- ICE global physical-risk model, cooling degree days and excess mortality on a 0.5° grid by SSP scenario. Country/city figures aggregated as the mean over inhabited grid cells; 2025 and 2050 linearly interpolated.
- Heatwave cooling degree days estimated from reported daily high/low temperatures (Met Office; Météo-France), daily mean ≈ (high + low) / 2, base 18 °C. Normal annual CDD from the relevant grid cell of the ICE global physical-risk model (SSP5-8.5, 2025).
Limitations
This presentation contains information that is property of Intercontinental Exchange, Inc. and/or its affiliates (“ICE Group”), and is not to be published, reproduced, copied, modified, disclosed or used without the express written consent of ICE Group.
This presentation is provided for informational purposes only. The information contained herein is subject to change without notice. Nothing herein should in any way be deemed to alter the legal rights and obligations contained in agreements between ICE Group and their respective clients relating to any of the products or services described herein. Nothing herein is intended to constitute legal, tax, accounting, investment or other professional advice.
ICE Group makes no warranties whatsoever, either express or implied, as to merchantability, fitness for a particular purpose, or any other matter. Without limiting the foregoing, ICE Group makes no representation or warranty that any data or information supplied to or by it are complete or free from errors, omissions, or defects and nothing contained herein should constitute any form of warranty, representation, or undertaking.
All feature values included in the products and services described herein are estimates, including those values that are derived using data provided by other data providers as well as forecasts of expectations of change. Such estimates are based upon information available to ICE Group at the time of calculation, are provided as is, and should be treated as estimates and forecasts with potentially substantial deviations from actual outcomes, regardless of whether such features are explicitly described in any data dictionary, methodology, or definition as estimates or forecasts.
Where required, the features are developed using a set of methodologies designed to prevent any form of reverse engineering or geographic identification from the features in isolation or in combination, but still provide potentially meaningful insights regarding the underlying securities.
ICE Group is not registered as a nationally registered statistical rating organization, nor should this document be construed to constitute an assessment of the creditworthiness of any company or financial instrument. Analytics available through the service are meant to be generally indicative of overall feature sets and should not be considered an analyst’s opinion of the underlying investability of a particular location or security. These analytics are designed to help summarize and aggregate large amounts of information, but will therefore not capture the nuances, or the “full picture” of any entity’s features. No part of this service should be construed as providing investment advice. Listing or linking to sources in attribution does not indicate endorsement by ICE Group of the data source, nor does it reflect an endorsement by the data provider of the products or services described herein.
GHG emissions information available is either compiled from publicly reported information or estimated, as indicated in the applicable product and services.
ICE Data Services refers to a group of products and services offered by certain Intercontinental Exchange, Inc. (NYSE:ICE) companies and is the marketing name used for ICE Data Services, Inc. and its subsidiaries globally, including ICE Data Indices, LLC, ICE Data Pricing & Reference Data, LLC, ICE Data Services Europe Limited and ICE Data Services Australia Pty Ltd. ICE Data Services is also the marketing name used for ICE Data Derivatives, Inc., ICE Data Analytics, LLC, and certain other data products and services offered by other affiliates of Intercontinental Exchange, Inc. (NYSE:ICE).
Trademarks of ICE Group include: Intercontinental Exchange, ICE, ICE block design, NYSE, ICE Data Services, ICE Data and New York Stock Exchange. Information regarding additional trademarks and intellectual property rights of ICE Group is located at www.intercontinentalexchange.com/terms-of-use. Other products, services, or company names mentioned herein are the property of, and may be the service mark or trademark of, their respective owners.
© 2026 Intercontinental Exchange, Inc.
Related resources
- view nowICE Climate
Quantifying climate risk and opportunities in fixed income and real estate.
- Learn moreICE Climate Analytics for Municipal Debt
Climate risk has the potential to upend the municipal market.